Ether golden cross fuels multi‑month outperformance versus Bitcoin
The Ether golden cross on the ETH/BTC ratio signals a potential multi‑month rally that could keep ether ahead of Bitcoin.
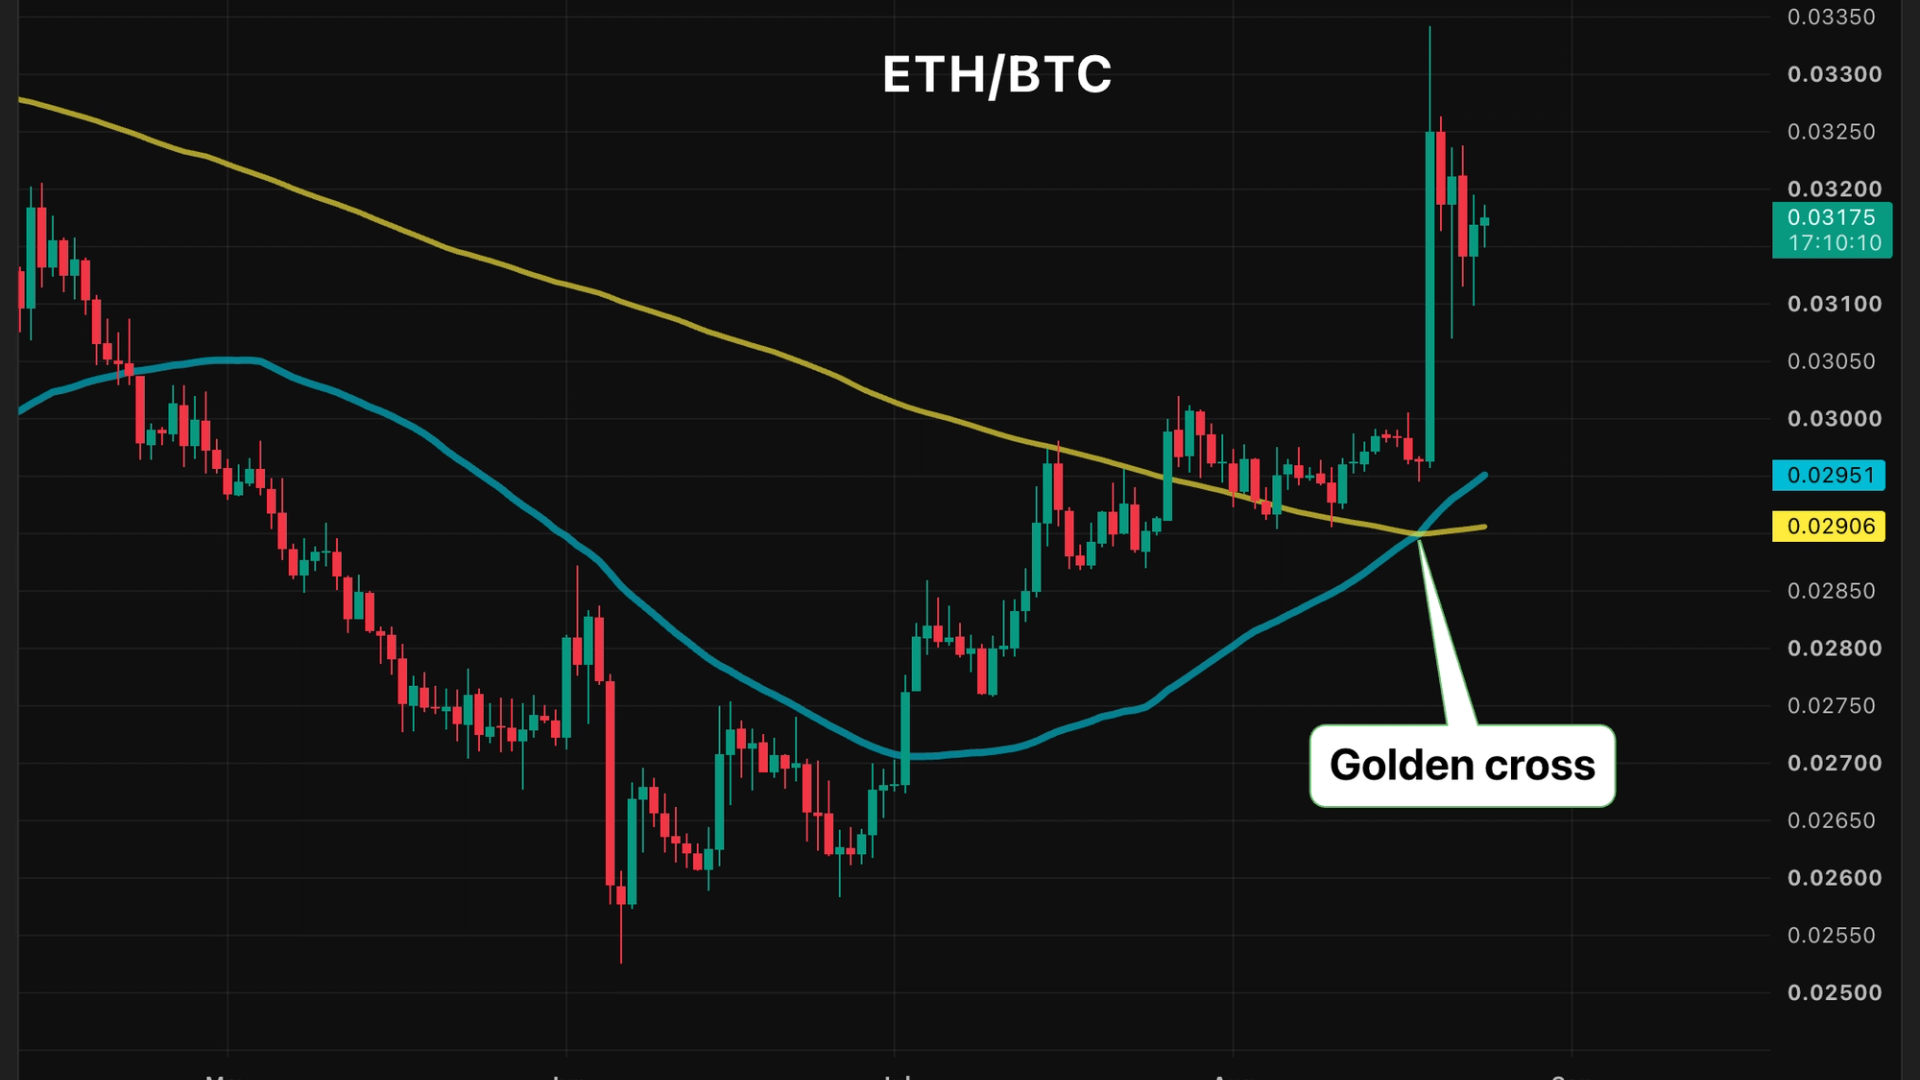
Ether golden cross activity is reshaping how institutions view the ETH/BTC relationship. A bullish cross on the ETH/BTC ratio emerged on July 25, 2025 and has since driven the pair up 25% from its June 6 trough. The signal matters because it changes risk calculations for custodians, DeFi lenders, and exchange market makers.
Data behind the Ether golden cross
- Ratio lift: ETH/BTC rose from ~0.058 on June 6 to ~0.073 by early August, a 25% gain.
- Moving-average mechanics: The 50-day average (~0.070) crossed the 200-day average (~0.065) on July 25, creating the classic golden-cross silhouette on TradingView.
- Historical context: Prior Ether golden crosses in February 2021 delivered a 93% rally, while those in May 2022 and August 2022 turned into rapid bull traps.
- Volume signal: On-chain activity shows a 12% uptick in ether transfers over the past two weeks, suggesting that the price move is supported by real-world usage rather than pure speculation.
The golden cross is a lagging indicator; it reflects past price momentum, not a guarantee of future direction.
Why the Ether golden cross matters for product teams
- DeFi lending platforms such as Term Finance must reassess collateral ratios. A stronger ether price reduces liquidation risk for borrowers but raises the cost of borrowing for lenders who hedge with bitcoin.
- Custodians (e.g., Fireblocks, Coinbase Custody) will see a shift in asset-mix requests. Clients demanding higher ether exposure may prompt custodians to expand cold-storage capacity and refine insurance models.
- Exchange order-book design: Market makers may need to widen ETH/BTC spreads to accommodate higher volatility, influencing fee structures and market-making incentives.
- Risk-engine updates: Portfolio-risk engines that weight assets by volatility will need to recalibrate models now that ether’s 30-day volatility has slipped from 68% to 54%.
Institutional appetite and capital-market dynamics
The Ether golden cross aligns with a broader trend of institutions treating ether as a hedge against bitcoin’s regulatory headwinds. Ray Dalio’s recent comment that investors should hold “a bit of Bitcoin” as U.S. debt risk rises underscores a diversification mindset that now includes ether, especially after the ratio’s breakout.
- Capital-market funding: Institutional funds are allocating more of their crypto-allocation to ether-denominated products, a shift mirrored in the growth of ether-based ETFs and futures.
- Liquidity pools: Uniswap v4’s new concentrated-liquidity pools for ETH/BTC pairs have seen a 38% rise in total value locked since the golden cross formed, indicating that market participants are actively providing depth.
- Regulatory lens: The SEC’s recent focus on stablecoin custodians does not directly affect ether, but heightened scrutiny on crypto assets encourages firms to favor assets with clearer governance, a niche where ether’s development roadmap is transparent.
Caveats and historical failures
Not every golden cross translates into a sustained rally. The July 25, 2025 cross initially delivered a 36% surge before the ratio reversed into a steeper downtrend. Analysts caution that:
- External shocks (e.g., macro-economic data releases, sudden regulatory announcements) can invalidate the momentum captured by moving averages.
- Algorithmic trading: High-frequency strategies may front-run the cross, creating short-term price spikes that quickly fade.
- Liquidity crunch: If major custodians pull ether from the market to meet redemption requests, the ratio could experience a sharp correction.
Human impact: traders, developers, and end-users
- Retail traders: The visible bullish pattern encourages entry points for new participants, potentially inflating retail exposure to ether’s volatility.
- Developers: Projects building on Ethereum’s layer-2 solutions (e.g., Optimism, Arbitrum) may see increased demand for gas-price subsidies, prompting them to adjust fee-rebate mechanisms.
- End-users: Payments apps that rely on ether for gas (e.g., Fasset’s stablecoin-backed payments) could benefit from lower transaction costs if ether’s price stabilizes, improving user experience.
What to watch next
| Indicator | Current Level | Threshold for Concern |
|---|---|---|
| ETH/BTC 50-day MA | 0.070 | Drop below 0.065 |
| ETH on-chain transfer volume | +12% (2-week) | Decline >5% week-over-week |
| BTC volatility index | 62 | Rise above 70 |
Analysts recommend monitoring the 50-day moving average’s ability to stay above the 200-day line, as a breach would signal a potential reversal. Additionally, any major macro-event—such as a U.S. Treasury policy shift—could quickly alter risk sentiment.
Independent research corroborates the trend
Chainalysis’s 2023 Crypto Market Report notes that periods when ether outperforms bitcoin by more than 20% often coincide with increased institutional on-chain activity and higher DeFi liquidity utilization. This external validation supports the view that the current golden cross is not merely speculative noise.
Market-size context via independent traffic estimates
The surge in interest around ether’s technical signal is reflected in web-traffic patterns: independent traffic estimates show a 22% rise in searches for “ETH/BTC golden cross” over the past month, indicating heightened curiosity among both retail and professional audiences.
Design implications for crypto-infrastructure products
Product managers building dashboards for crypto-asset allocation must now surface ETH/BTC ratio trends alongside traditional price charts. UI/UX teams should consider:
- Real-time moving-average overlays that auto-update as new price data streams in.
- Alert mechanisms that trigger when the 50-day MA crosses the 200-day MA, allowing traders to act promptly.
- Risk-heat maps that visualize the ratio’s volatility relative to overall portfolio exposure. These design choices reduce cognitive load for traders and improve decision-making speed, especially in fast-moving markets.
Source reference
For a broader view of market dynamics, see the original analysis on Coindesk Markets (source link).
Bottom line
Ether’s golden cross is a statistically rare event that has historically produced both strong rallies and abrupt busts. The current 25% gain in the ETH/BTC ratio suggests a meaningful shift in market dynamics, prompting custodians, DeFi platforms, and institutional investors to reassess risk models, product features, and liquidity strategies. While the signal is promising, it remains contingent on macro-economic stability and the absence of adverse regulatory developments. Stakeholders should track moving averages, on-chain volume, and broader market volatility to gauge whether ether’s outperformance will persist or revert.